


Debugging in VS Code and Chrome
Every application reaches a point where it’s necessary to understand failures, small to large. In this recipe, we explore a few workflows for VS Code users, who are using Chrome to test.
This recipe shows how to use the Debugger for Chrome extension with VS Code to debug Vue.js applications generated by the Vue CLI.
Prerequisites
You must have Chrome and VS Code installed. Make sure to get the latest version of Debugger for Chrome extension installed in VS Code.
Install and create a project with the vue-cli, with the instructions for installation documented in the readme of the project. Change into the newly created application directory and open VS Code.
Showing Source Code in the Chrome Devtools
Before you can debug your Vue components from VS Code you need to update the generated Webpack config to build sourcemaps. We do this so that our debugger has a way to map the code within a compressed file back to its position in the original file. This ensures that you can debug an application even after your assets have been optimized by Webpack.
Go to config/index.js and find the devtool property. Update it to:
devtool: 'source-map', |
Launching the Application from VS Code
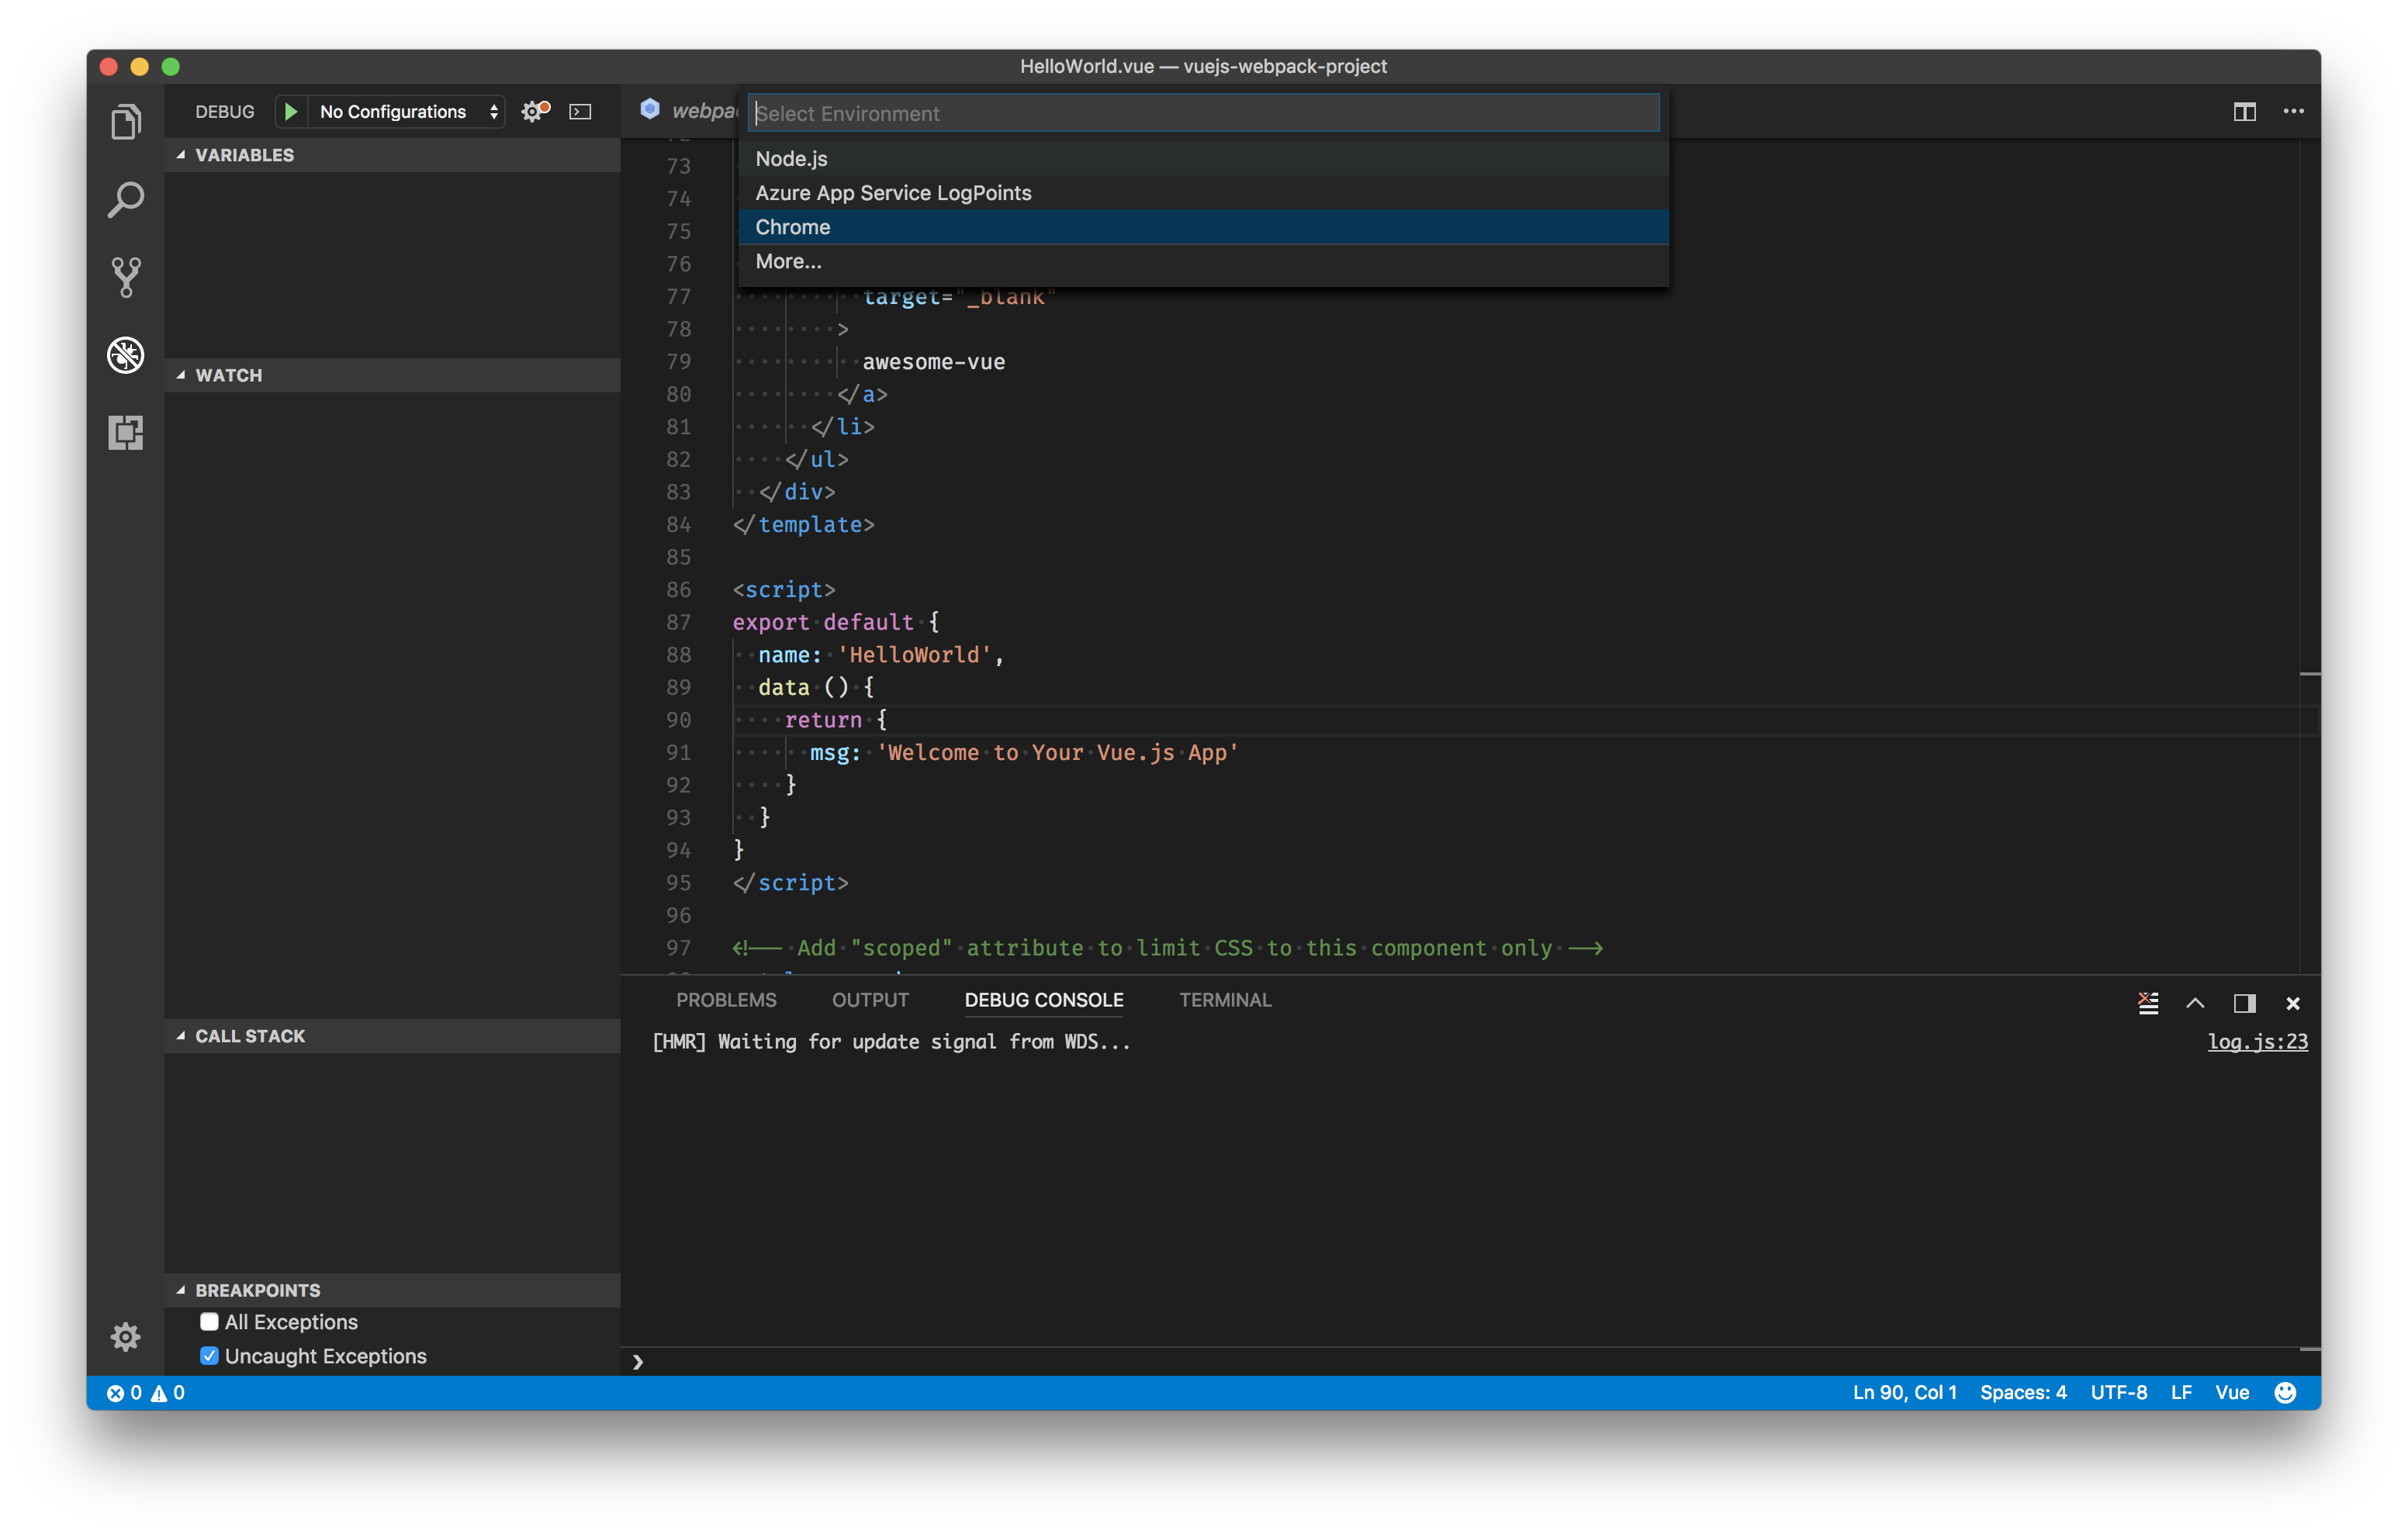
Click on the Debugging icon in the Activity Bar to bring up the Debug view, then click on the gear icon to configure a launch.json file, selecting Chrome for the environment. Replace content of the generated launch.json with the following two configurations:
{ |
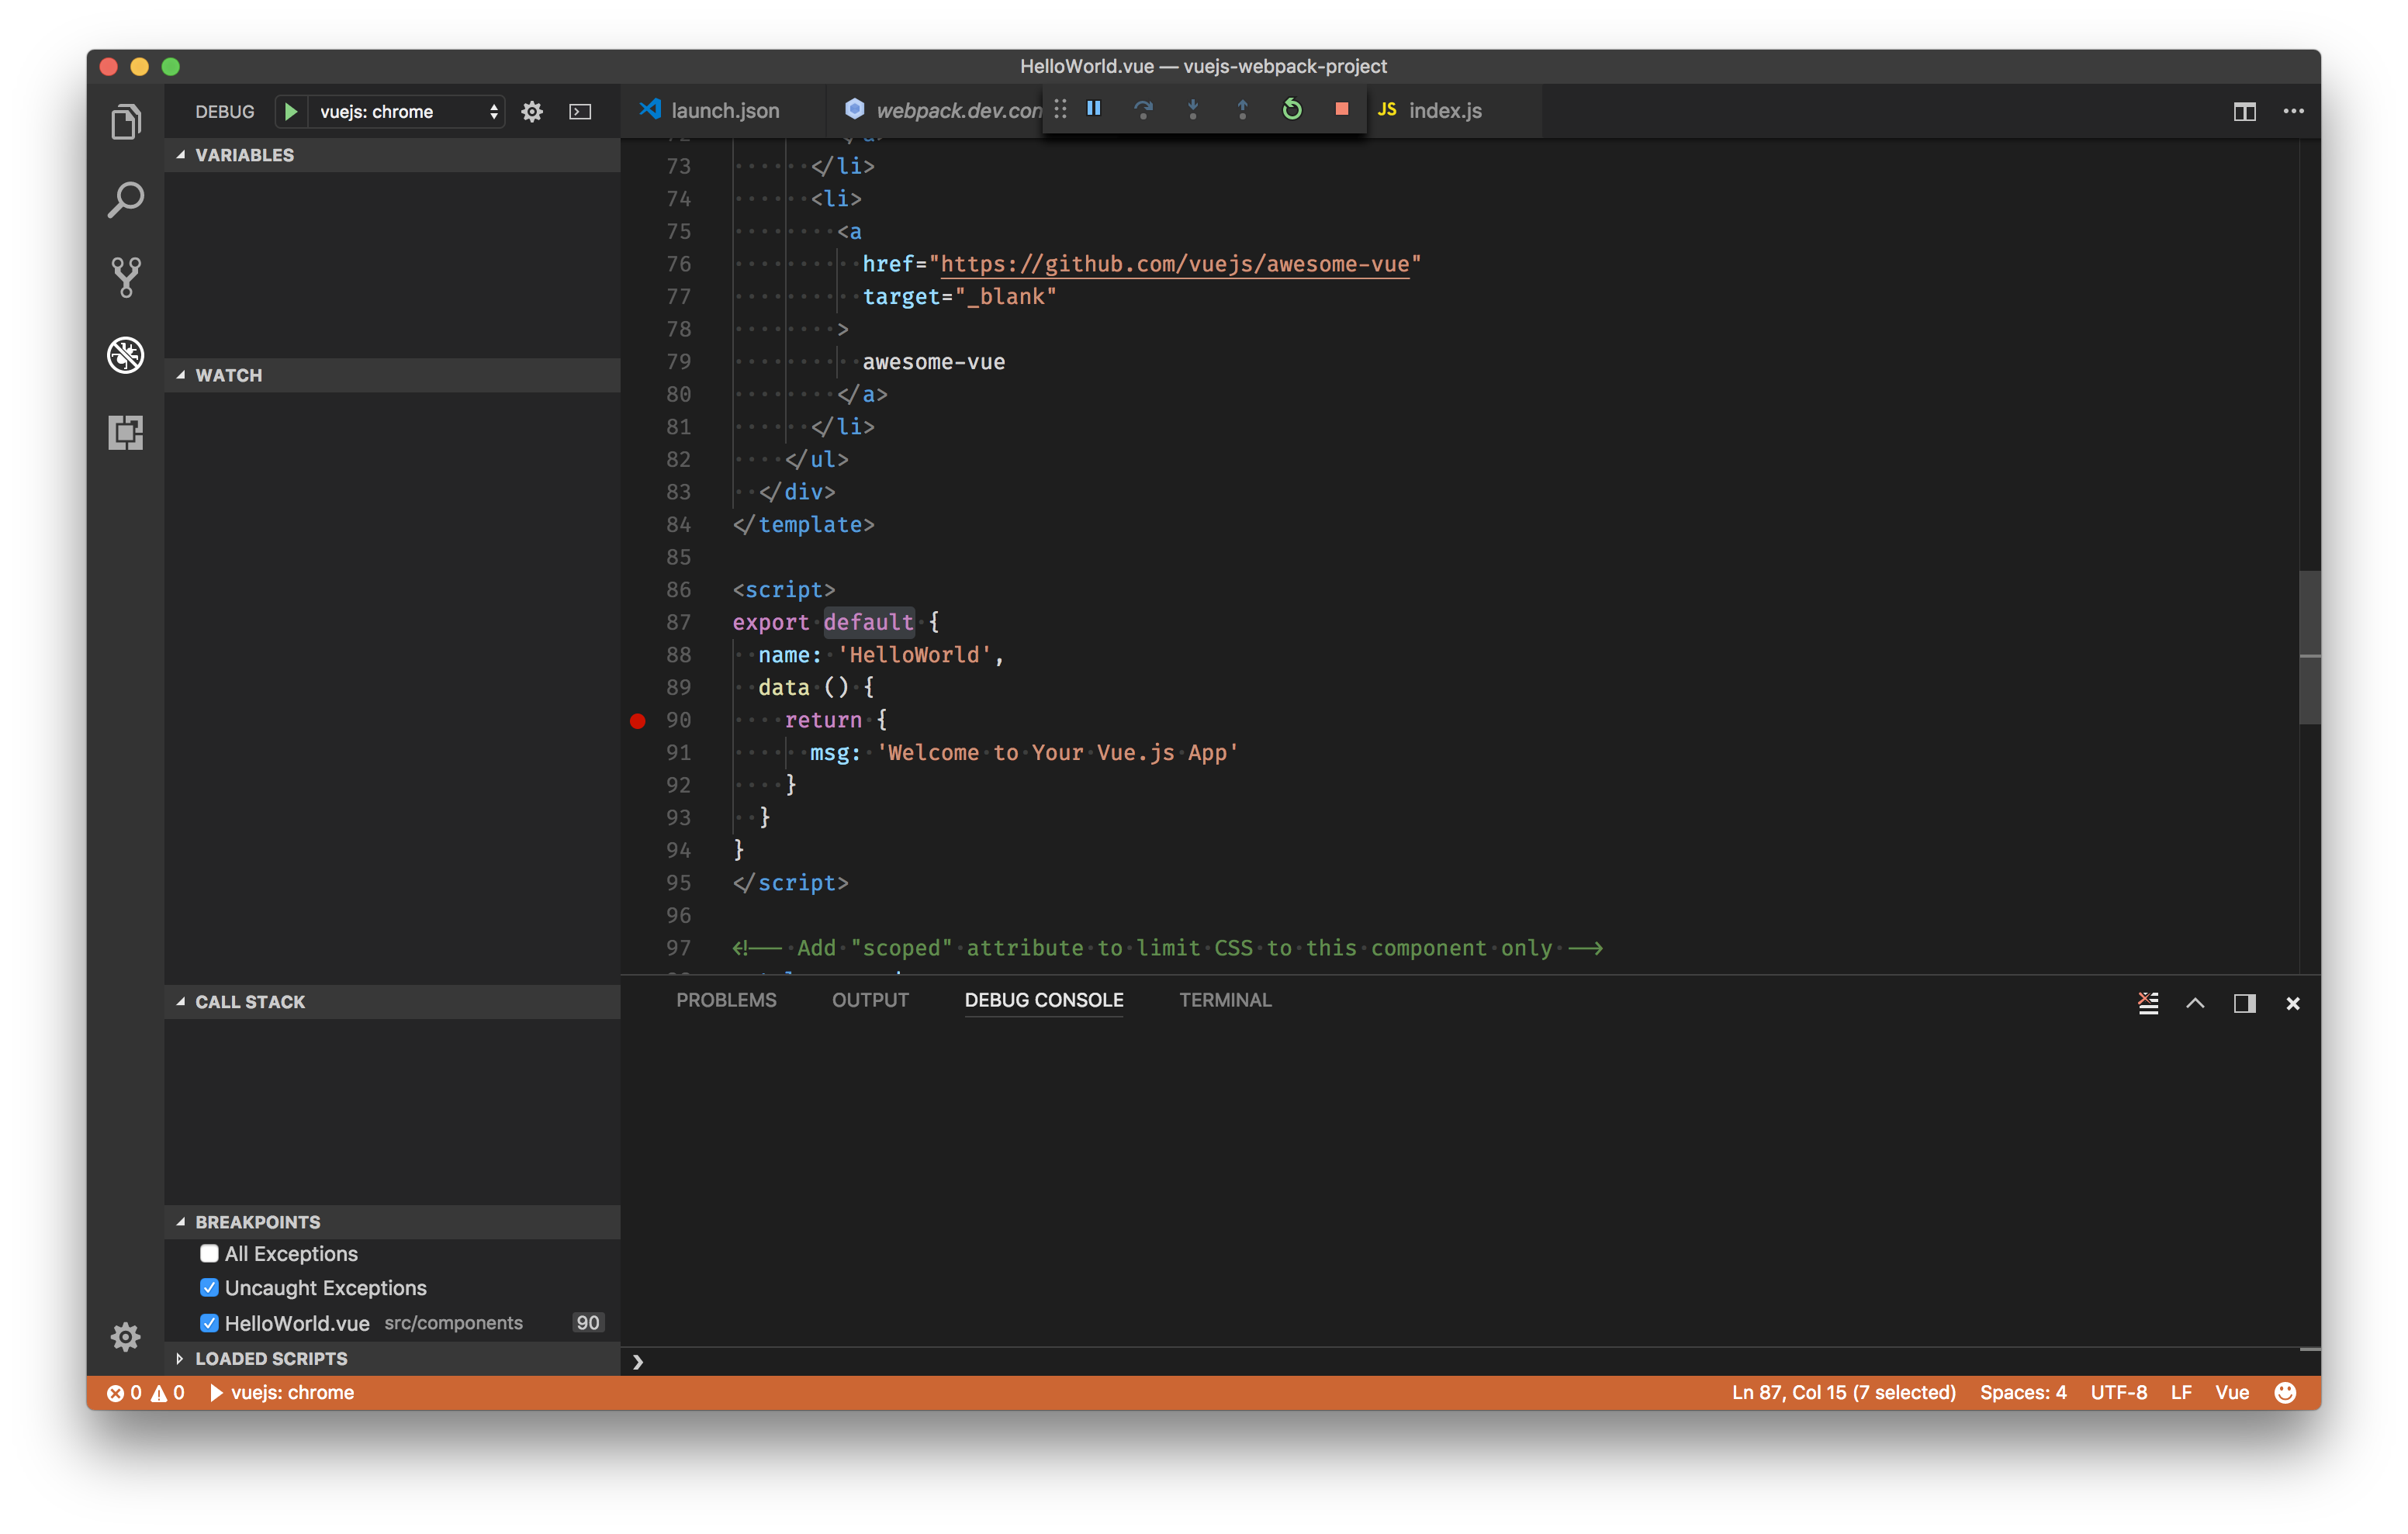
Setting a Breakpoint
- Set a breakpoint in src/components/HelloWorld.vue on
line 90where thedatafunction returns a string.
- Open your favorite terminal at the root folder and serve the app using Vue CLI:
npm start |
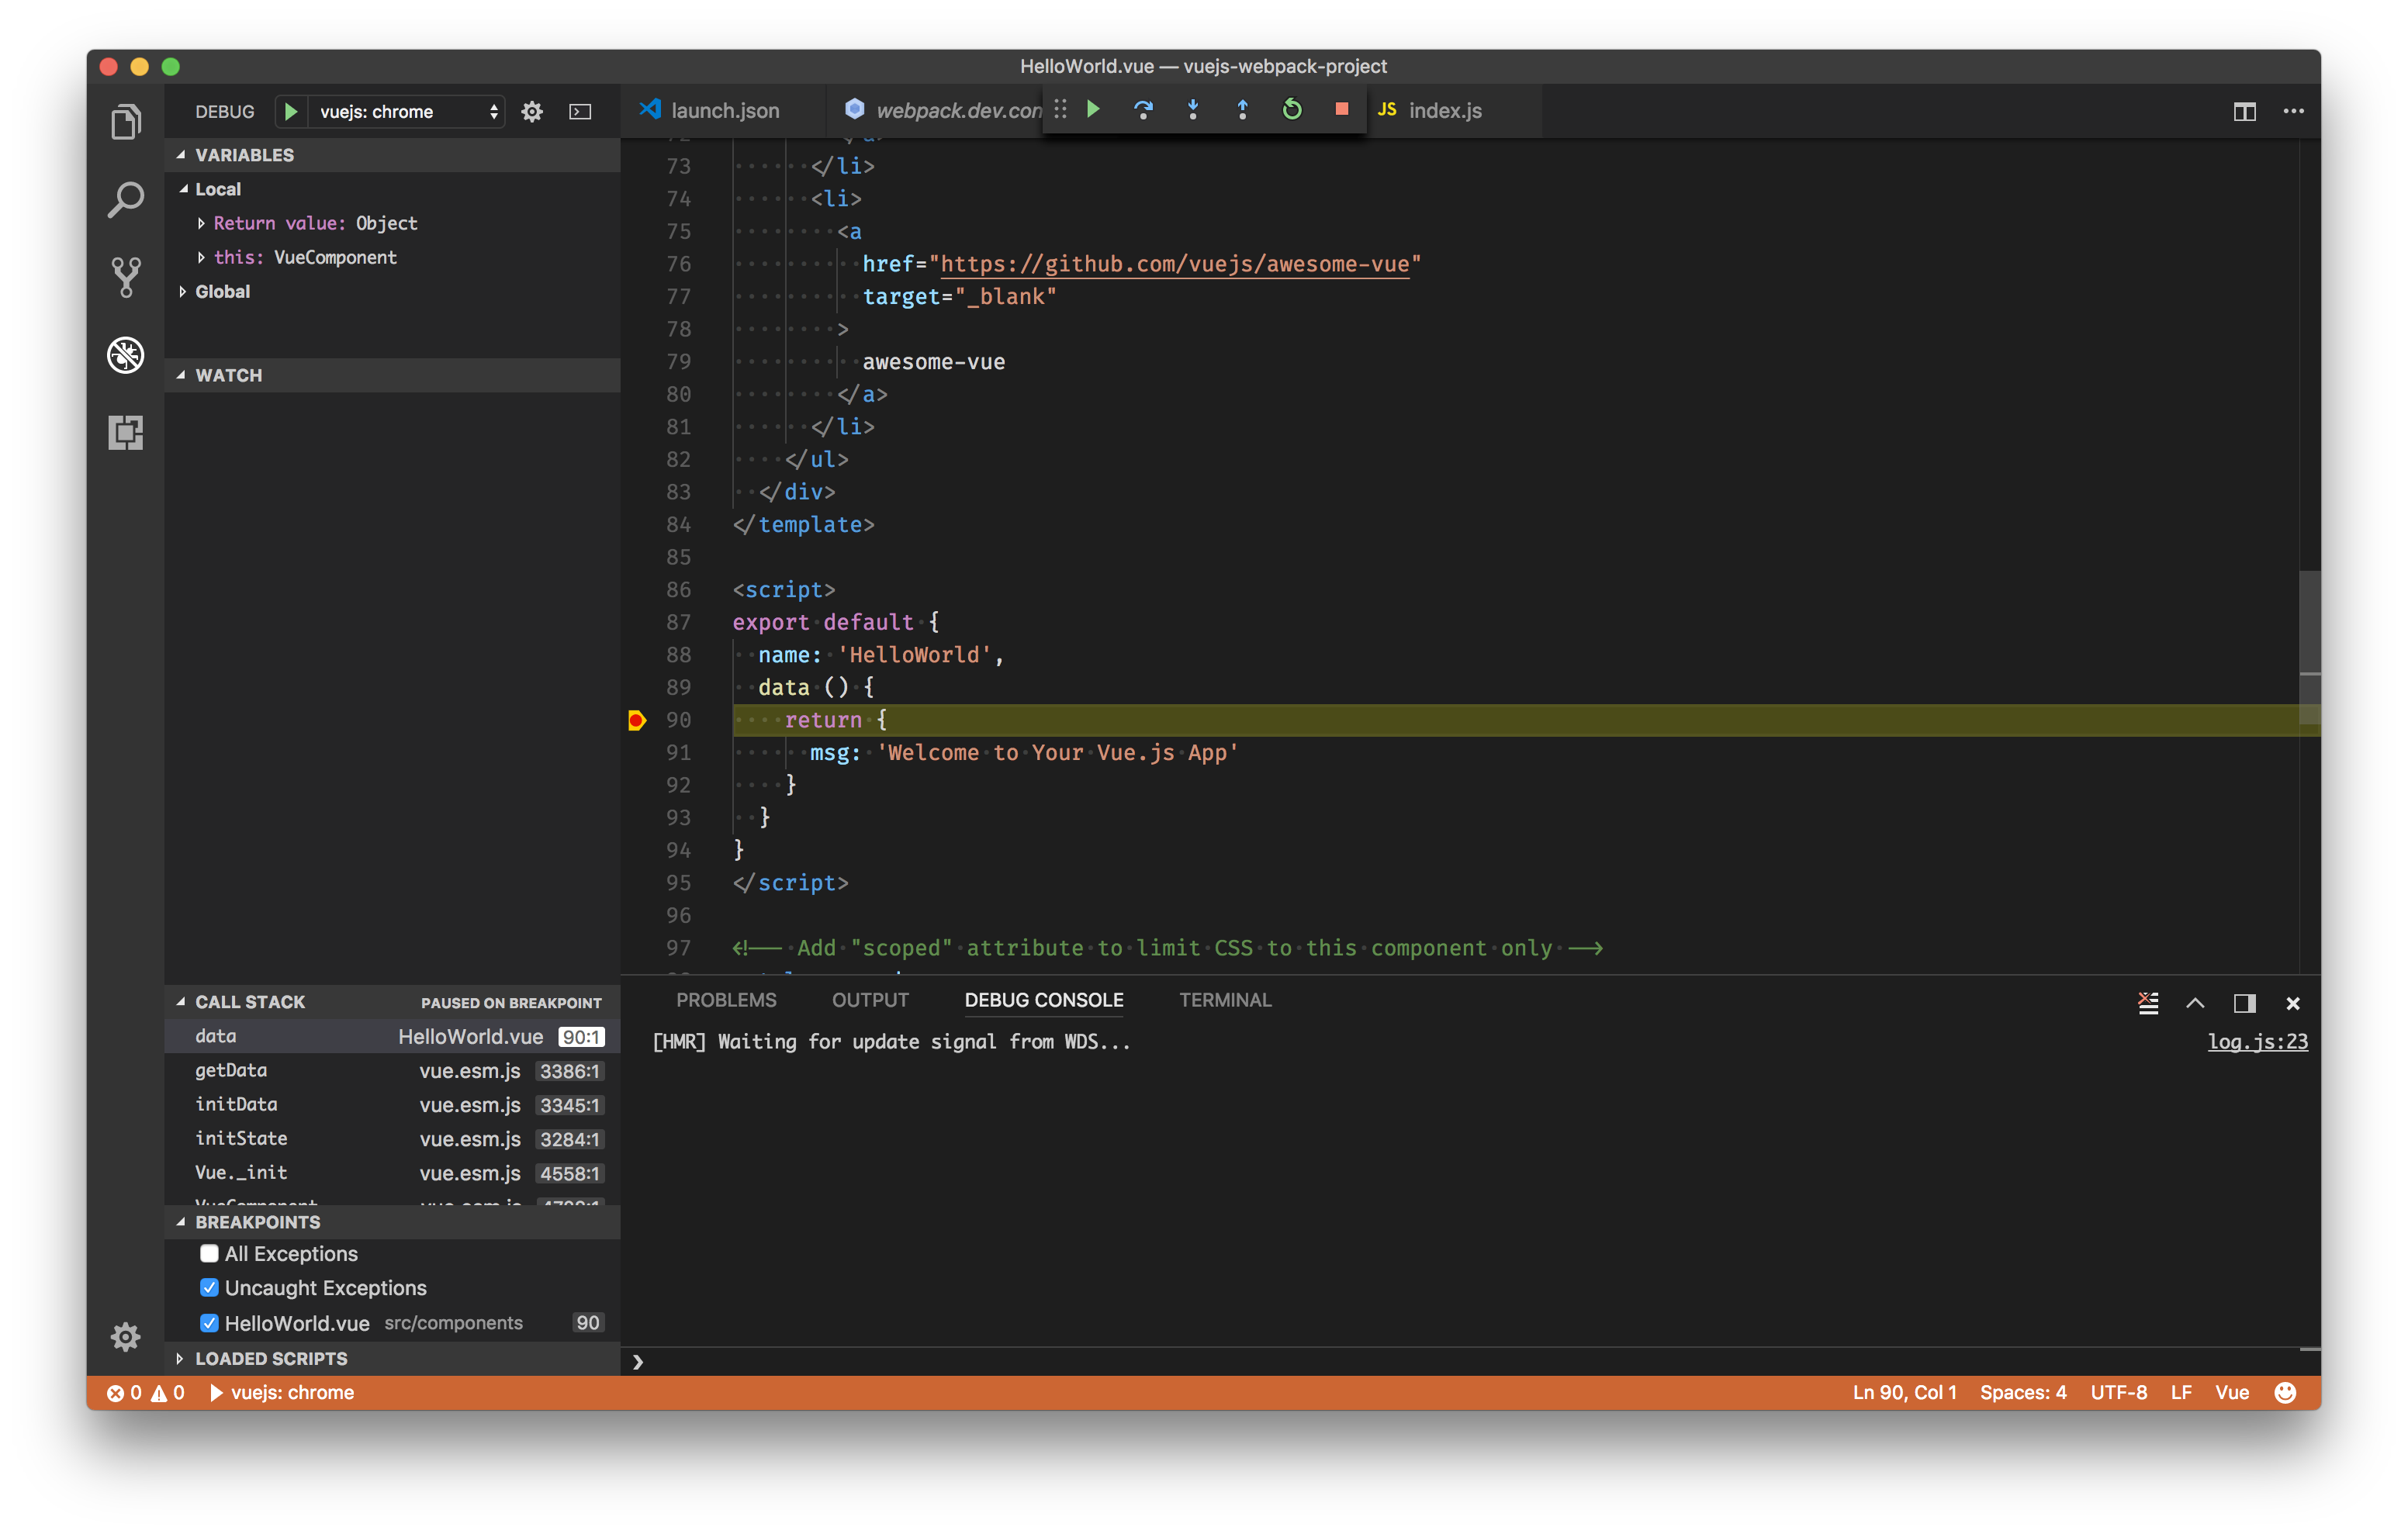
Go to the Debug view, select the ‘vuejs: chrome’ configuration, then press F5 or click the green play button.
Your breakpoint should now be hit as the new instance of Chrome opens
http://localhost:8080.
Alternative Patterns
Vue Devtools
There are other methods of debugging, varying in complexity. The most popular and simple of which is to use the excellent vue-devtools. Some of the benefits of working with the devtools are that they enable you to live-edit data properties and see the changes reflected immediately. The other major benefit is the ability to do time travel debugging for Vuex.
Please note that if the page uses a production/minified build of Vue.js (such as the standard link from a CDN), devtools inspection is disabled by default so the Vue pane won’t show up. If you switch to an unminified version, you may have to give the page a hard refresh to see them.
Vuetron
Vuetron is a really nice project that extends some of the work that vue-devtools has done. In addition to the normal devtools workflow, you are able to:
- Quickly view API Request/Response: if you’re using the fetch API for requests, this event is displayed for any request sent. The expanded card displays the request data as well as the response data.
- Subscribe to specific parts of your application’s state for faster debugging
- Visualize component hierarchy, and an animation allows you to collapse or expand the tree for specific hierarchy views.
Simple Debugger Statement
The example above has a great workflow. However, there is an alternative option where you can use the native debugger statement directly in your code. If you choose to work this way, it’s important that you remember to remove the statements when you’re done.
<script> |
Acknowledgements
This recipe was based on a contribution from Kenneth Auchenberg, available here.